COLLECTION 1 (4mb)Web ready set of 83 histograms, zipped folder, JPEGs, 500px long, 72 dpi
COLLECTION 2 (5mb) Web ready set of 83 histograms, zipped folder, JPEGs, 1000px long, 72 dpi
COLLECTION 3 (6mb) Print ready set of 83 histograms, zipped folder, JPEGs, 1500px long, 300 dpi
COLLECTION 4 (200kb) Files used to create the 83 histograms, zipped folder, CSV format
CSV (comma-separated value) is a file format readable by spreadsheet software like Excel and usable in programs like Adobe Illustrator.
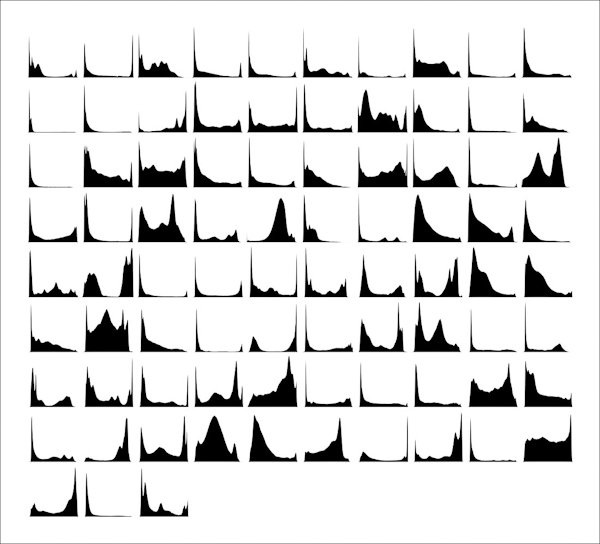
Please note: Because I was primarily interested in the histograms as a way to generate a set of abstract objects, I made the compositional decision to avoid an absolute scale for all graphs. In doing so, I deliberately sacrificed visual accuracy when comparing all the images to the same vertical axis.
This means that while the relationships plotted for an individual graph are internally consistent, the high points for two separate graphs that look equal are likely to be different (one could be 10,000 pixels and the other 40,000). This becomes obvious when deriving the individual histograms from the CSV files.
For a resource on how to generate and export histogram data from an image using Photoshop, click here.